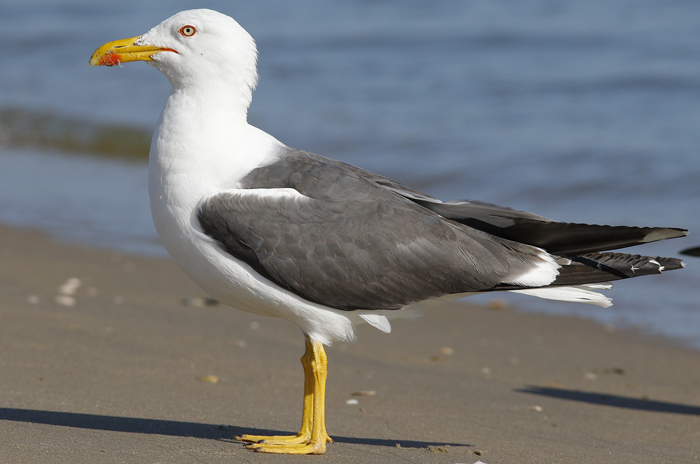
 Lesser Black-backed Gull (graellsii & intermedius)
(last update:
lbbg 1cy May
lbbg 1cy June
lbbg 1cy July
lbbg 1cy August
lbbg 1cy September
lbbg 1cy October
lbbg 1cy November
lbbg 1cy December
lbbg 2cy January
lbbg 2cy February
lbbg 2cy March
lbbg 2cy April
lbbg 2cy May
lbbg 2cy June
lbbg 2cy July
lbbg 2cy August
lbbg 2cy September
lbbg 2cy October
lbbg 2cy November
lbbg 2cy December
lbbg 3cy January
lbbg 3cy February
lbbg 3cy March
lbbg 3cy April
lbbg 3cy May
lbbg 3cy June
lbbg 3cy July
lbbg 3cy August
lbbg 3cy September
lbbg 3cy October
lbbg 3cy November
lbbg 3cy December
lbbg sub-ad January
lbbg sub-ad February
lbbg sub-ad March
lbbg sub-ad April
lbbg sub-ad May
lbbg sub-ad June
lbbg sub-ad July
lbbg sub-ad August
lbbg sub-ad Sept
lbbg sub-ad Oct
lbbg sub-ad Nov
lbbg sub-ad Dec
lbbg adult January
lbbg adult February
lbbg adult March
lbbg adult April
lbbg adult May
lbbg adult June
lbbg adult July
lbbg adult August
lbbg adult September
lbbg adult October
lbbg adult November
lbbg adult December
adult: August
adults in the colony
In the Maasvlakte colony many adults try to raise two juveniles. As soon as the fledglings can move, the family tries to find a more comfortable place outside the colony, often at the beach or the near fresh water lakes. By the end of August, 99% of the adult LBBG from the Maasvlakte and their juveniles (approximately 70.000 birds) have left the Maasvlakte and start migrating south (at least leave the immediate feeding grounds around the colony). For a while, they gather at the beach, in mixed groups of different age-classes.
Several 1.000s of LBBG can be present up to mid September. In these groups the races graellsii and intermedius are both present, but hard evidence to categorize adults to certain races is very difficult, and classification is often only possible when birds are banded / ringed. From mid-October numbers of LBBG decrease rapidly.

Lesser Black-backed Gull graellsii adult, August 21 2015, Katwijk, the Netherlands. Bird in complete moult: P1 new, P3-P10 still old. Local breeding bird with begging young.
moult in the primaries
August is normally a month when primary moult is easy to detect, even on adult birds with folded wings. A small survey of adults in the Maasvlakte colony did not point to a significant primary moult delay in adults with begging youngs in the colony. Individual variation in adult LBBG within a certain colony seems to be at least as large as primary moult variation between colonies of Dutch intergrades and presumed intermedius from Scandinavia. In the table below, remaining old primaries are plotted for mixed groups graellsii, Dutch intergrades and intermedius at the Maasvlakte in the second half of August. Probably, most birds originate from the nearby colony and are Dutch intergrades, but large groups of Scandinavian birds arrive from mid-August onwards.
Intermedius LBBG from Denmark and southern Norway (intermedius) probably arrive later on the breeding grounds in spring, compared to Dutch intergrades. Subsequently, it may be expected that egg-laying date is later in these populations. It remains to be seen whether or not they show delay in primary moult stage. Such surveys should only involve ringed (certain origin) adults. At this moment, such surveys are impossible; comparable analyses are unreliable by lack of sufficient ring observations.
So far, the hypothesis that intermedius have delay in primary moult could not be verified, but if it's true, the average remaining old primary figure in the table is overestimated (if read as applying to Dutch intergrades) by the input of intermedius arriving in August and later on. On the other hand, it is expected that Dutch intergrades with low moult score (arrested or suspended moult) are keen to leave the Netherlands as soon as possible, leaving a group of adults with relatively high moult score. At this moment, the figures in the table can be used as indication for "what average moult stage can be expected in the second half of August in LBBGs of various origins, present in the Netherlands".
Tables & Graph
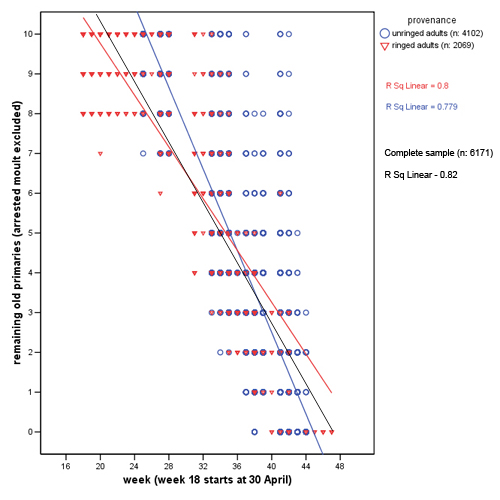
Above: Scatter Plot for PMS in adult Lesser Black-backed Gulls. Number of remaining old primaries for August (arrested moult excluded). Sample size for this graph is 357 ringed birds + 1137 unringed birds.
starting date:
|
09 Jul
|
13 Aug
|
20-Aug
|
27-Aug
|
10 Sep
|
week no:
|
28
|
33
|
34
|
35
|
37
|
NEW 0
|
115
|
3
|
2
|
1
|
0
|
NEW P1
|
6
|
2
|
4
|
0
|
0
|
NEW P2
|
0
|
6
|
7
|
2
|
0
|
NEW P3
|
0
|
7
|
10
|
12
|
0
|
NEW P4
|
0
|
8
|
1
|
25
|
6
|
NEW P5
|
0
|
1
|
1
|
5
|
13
|
NEW P6
|
0
|
0
|
1
|
0
|
11
|
NEW P7
|
0
|
0
|
0
|
0
|
3
|
NEW P8
|
0
|
0
|
0
|
0
|
0
|
NEW P9
|
0
|
0
|
0
|
0
|
0
|
NEW P10
|
|
|
|
|
|
|
|
|
|
|
|
n =
|
121
|
27
|
26
|
45
|
33
|
average NEW P =
|
0.0
|
2.7
|
2.4
|
3.7
|
5.3
|
95% CID =
|
0.04
|
0.55
|
0.55
|
0.27
|
0.32
|
inverse =
|
1.98
|
2.06
|
2.06
|
2.02
|
2.04
|
Variantie (s2) =
|
0.05
|
1.92
|
1.85
|
0.82
|
0.79
|
SD (s) =
|
0.22
|
1.39
|
1.36
|
0.90
|
0.89
|
SE (sx) =
|
0.02
|
0.27
|
0.27
|
0.13
|
0.15
|
|
|
|
|
|
|
% class
|
|
|
|
|
|
0
|
95
|
11
|
8
|
2
|
0
|
1
|
5
|
7
|
15
|
0
|
0
|
2
|
0
|
22
|
27
|
4
|
0
|
3
|
0
|
26
|
38
|
27
|
0
|
4
|
0
|
30
|
4
|
56
|
18
|
5
|
0
|
4
|
4
|
11
|
39
|
6
|
0
|
0
|
4
|
0
|
33
|
7
|
0
|
0
|
0
|
0
|
9
|
8
|
0
|
0
|
0
|
0
|
0
|
9
|
0
|
0
|
0
|
0
|
0
|
10
|
0
|
0
|
0
|
0
|
0
|
|
|
|
|
|
|
% control:
|
100
|
100
|
100
|
100
|
100
|
NEW0 = no new primaries visible (arrested moult excluded in this analysis). So either P1 still old, or P1 dropped, but the very tip still not visible.
NEW1 = P1 longest new primary. Range between "at least the tip of P1 is visible" until "tip of P2 still shorter than P1".
NEW2 = P2 longest new primary. NEW3 = etc.
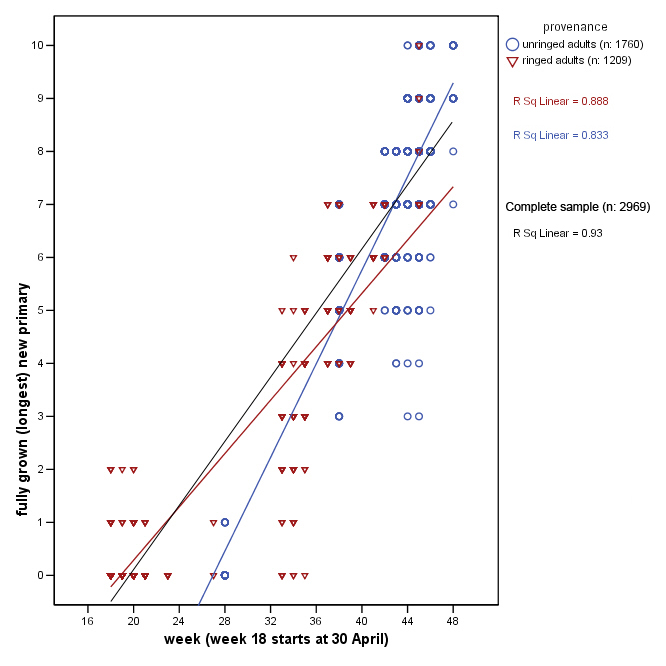
Above: Scatter Plot for PMS in adult Lesser Black-backed Gulls throughout the year. Longest new primary is classified "fully grown". Sample size is 2.969 birds. Birds scored on NEW primaries (arrested moult excluded).
Above: Scatter Plot for PMS in adult Lesser Black-backed Gulls. Scoring on longest new primary, which is classified "fully grown" for August (arrested moult excluded). Sample size for this graph is 98 ringed birds.
The earliest date for birds with missing primaries is 30 April 2006, which is not the earliest day in our complete sample. We scored 98 Lesser Black-backed Gulls prior to that date, some already in February. As can be expected, none of these was in primary moult, and this group was excluded in our further analysis as it will only result in a misfit for the onset of moult, using linear regression statistics.
The last scoring days were in November, with a larger sample (133 adults) on 04 November 2010. From that date we have the last birds with retaining old primaries (13 birds with 1, 2 or even 3 old primaries; 120 birds with no old primaries left). From other days in November, only 10 birds were scored (all ringed adults). They all had no old primaries left.
The first tine a new primary (P1) was visible, was on 08 May 2006. Prior to this date, birds were scored missing inner primaries, but the very tip was still not visible (and therefore not scored). As soon as the tip of P1 was visible, this was automatically scored "fully grown" For the other primaries to be scored fully grown, they had to exceed the previous primary in length (so P2 fully grown, only from when it is longer than P1).
|
Netherlands
|
|
||||
|
PMS range
|
N:
|
Average PMS
|
PMS range
|
N:
|
Average PMS
|
1-15 apr
|
10
|
49
|
10
|
8-10
|
216
|
9,9
|
16-30 apr
|
10
|
47
|
10
|
10
|
197
|
10,0
|
1-15 may
|
8-10
|
849
|
9,8
|
8-10
|
167
|
9,9
|
16-31 may
|
7-10
|
380
|
9,7
|
7-10
|
76
|
9,5
|
1-15 jun
|
8-10
|
104
|
9,6
|
7-10
|
33
|
8,6
|
16-30 jun
|
7-10
|
253
|
9,7
|
6-10
|
65
|
8,2
|
1-15 jul
|
6-10
|
605
|
9,2
|
5-10
|
176
|
7,4
|
16-31 jul
|
-
|
-
|
-
|
4-8
|
44
|
6,4
|
1-15 aug
|
3-10
|
143
|
6,6
|
3-10
|
165
|
5,2
|
16-31 aug
|
2-10
|
1284
|
5,4
|
3-8
|
127
|
4,6
|
1-15 sep
|
1-10
|
300
|
3,6
|
0-7
|
234
|
3,3
|
16-30 sep
|
0-7
|
645
|
2,9
|
0-7
|
173
|
2,1
|
1-15 oct
|
0-9
|
733
|
2,2
|
0-4
|
328
|
0,9
|
16-31 oct
|
0-10
|
750
|
1,3
|
0-3
|
244
|
0,3
|
1-15 nov
|
0-3
|
138
|
0,2
|
0-3
|
604
|
0,1
|
16-30 nov
|
0
|
5
|
0
|
0-1
|
341
|
0,0
|
LINEAR REGRESSION
Onset of primary moult can best be illustrated by a sinusoid for the first few weeks and last weeks, but there appears to be linear dependency over much of the central moult period.
LINEAR REGRESSION FOR OLD REMAINING PRIMARIES
Complete sample: Linear regression (n = 6171, R2= 0.820, sign: P<0,000)
PMS = -0,381* WEEK + 17,967
Ringed adults: Linear regression (n = 2069, R2= 0.800, sign: P<0,000)
PMS = -0,325* WEEK + 16,270
Unringed adult: Linear regression (n = 4102, R2= 0.779, sign: P<0,000)
PMS = -0,513* WEEK + 23,031
LINEAR REGRESSION FOR NEW FULLY GROWN PRIMARIES
Complete sample: Linear regression (n = 2969, R2= 0.930, sign: P<0,000)
PMS = 0,302* WEEK - 5,933
Ringed adults: Linear regression (n = 1209, R2= 0.888, sign: P<0,000)
PMS = 0,252* WEEK - 4,747
Unringed adult: Linear regression (n = 1760, R2= 0.833, sign: P<0,000)
PMS = 0,442* WEEK - 11,906
| Remaining old primaries in adult LBBGs, August 2001. | ||||||||||||||
| 10 | 9 | 8 | 7 | 6 | 5 | 4 | 3 | 2 | n: | m: | V: | SD: | SE: | |
| 15/08: | 6 | 7 | 19 | 21 | 22 | 39 | 18 | 1 | - | 133 | 6,20 | 2,81 | 1,68 | 0,15 |
| 21/08: | 13 | 10 | 22 | 32 | 43 | 102 | 49 | 2 | - | 273 | 5,82 | 2,67 | 1,63 | 0,10 |
| 28/08: | 14 | 14 | 25 | 28 | 93 | 158 | 139 | 47 | 1 | 519 | 5,22 | 2,54 | 1,59 | 0,07 |
| First cell (10, 15/08 = 6) should be read: on August 15 2001, 6 adults had all 10 primaries old, hence showed no primary moult yet (this is about 4% on 133 observed adults that day). n: observations. m: average. V (= s2): variance. SD (= s): standard deviation. SE (s / sqr n): standard error. |
||||||||||||||
| Survey August 16 2001 Maasvlakte, the Netherlands. Adult primary score in the colony; adults with begging youngs. | |||||||
| p3 old | p4 old | p5 old | p6 old | p7 old | p8 old | n: | average: |
| 1 | 3 | 3 | 2 | 1 | 1 | 11 | 5,82 |
| Survey of old primaries in adult LBBG on August 22 2002 at Maasvlakte, the Netherlands (51.57N,04.03E). | |||
| Dintelhaven | Missouriweg | Papegaaienbek | |
| p1 old | 2 | - | 1 |
| p2 old | 4 | 1 | 5 |
| p3 old | 8 | - | 8 |
| p4 old | 32 | 1 | 10 |
| p5 old | 44 | 7 | 14 |
| p6 old | 96 | 26 | 12 |
| p7 old | 65 | 12 | 9 |
| p8 old | 3 | - | - |
| p9 old | 1 | - | - |
| p10 old | - | - | - |
| old prims n old prim m old prims SD old prims SE |
255 5.7 1.28 0.08 |
47 6.0 0.92 0.13 |
59 4.7 1.59 0.21 |
Notes: |
|||
 |
 |
 |
 |
 |
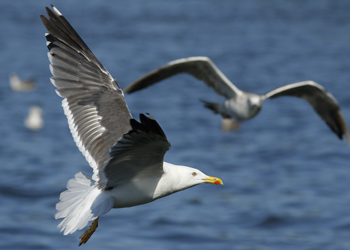 |
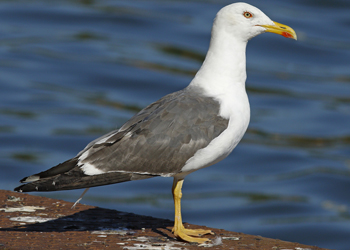
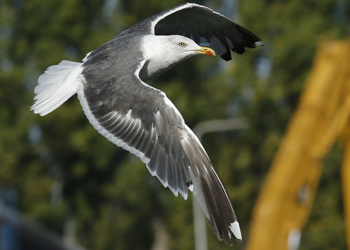
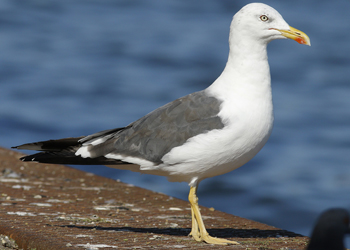
adult LBBG UK: graellsii
.
 Lesser Black-backed Gull graellsii RXB 5CY, August 01 2009, Calais, NW France. Picture: Jean-Michel Sauvage.
 Lesser Black-backed Gull graellsii 3.U0 adult, August 31 2017, Matosinhos beach, Matosinhos, Portugal. Picture: José Marques.
 Lesser Black-backed Gull graellsii 4.Z3 8CY-10CY, October 2015 - August 2017, Torreira beach, Beira Litoral, Portugal. Picture: José Marques.
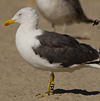 Lesser Black-backed Gull graellsii 2.F2 adult, August 31 2017, Matosinhos beach, Matosinhos, Portugal. Picture: José Marques.
 Lesser Black-backed Gull graellsii 3.H5 adult, August 18 2017, Leça beach, Matosinhos, Portugal. Picture: José Marques.
 Lesser Black-backed Gull graellsii 5.T9 8CY, August 17 2017, Matosinhos beach, Matosinhos, Portugal. Picture: José Marques.
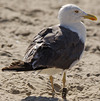 Lesser Black-backed Gull graellsii 8.V3 adult, August 31 2017, Matosinhos beach, Matosinhos, Portugal. Picture: José Marques.
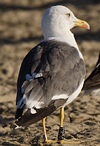 Lesser Black-backed Gull graellsii 0CK5 adult, August 31 2017, Matosinhos beach, Matosinhos, Portugal. Picture: José Marques.
 Lesser Black-backed Gull graellsii 2AC3 adult hybrid, August 17 2017, Leixões harbour, Matosinhos, Portugal. Picture: José Marques.
 Lesser Black-backed Gull graellsii 3AU9 adult, October 2015 & 2016, August 2017, Espinho Beach, Espinho, Aveiro, Portugal. Picture: José Marques.
 Lesser Black-backed Gull graellsii 4AM6 adult, August 31 2017, Matosinhos beach, Matosinhos, Portugal. Picture: José Marques.
 Lesser Black-backed Gull graellsii 5CJ1 5CY-6CY, February 2016 & August 2017, Praia da Aguda, V.N.Gaia, Portugal. Picture: José Marques.
 Lesser Black-backed Gull graellsii 6CF6 adult, October 2015, September 2016 - February 2017, August 2017, Matosinhos, Portugal. Picture: José Marques.
 Lesser Black-backed Gull graellsii 6CK8 adult, August 31 2017, Matosinhos beach, Matosinhos, Portugal. Picture: José Marques.
 Lesser Black-backed Gull graellsii 7AW7 adult, August 17 2017, Matosinhos Beach, Matosinhos, Portugal. Picture: José Marques.
 Lesser Black-backed Gull graellsii 7AX0 adult, December 2015, November 2016 & August 2017, Matosinhos beach, Matosinhos, Portugal. Picture: José Marques.
 Lesser Black-backed Gull graellsii 8AK3 adult, October - December 2015 & October - November 2016 & Augsut 2017, Matosinhos beach, Matosinhos, Portugal. Picture: José Marques.
 Lesser Black-backed Gull graellsii 8CL6 adult, October 2015 & August 2017, Matosinhos beach, Matosinhos, Portugal. Picture: José Marques.
 Lesser Black-backed Gull graellsii 8CS1 adult, October 2015 - August 2017, Leixões harbour, Matosinhos, Portugal. Picture: José Marques.
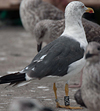 Lesser Black-backed Gull graellsii 9CF6 adult, August 2015 & September - October 2016, Matosinhos beach, Matosinhos, Portugal. Picture: José Marques.
 Lesser Black-backed Gull graellsii AXS adult, August 31 2017, Matosinhos beach, Matosinhos, Portugal. Picture: José Marques.
 Lesser Black-backed Gull graellsii Y98:M adult, August 08 2017, Leixões harbour, Matosinhos, Portugal. Picture: José Marques.
 Lesser Black-backed Gull graellsii BTO GK38437 28CY, 2008-2011, Boulogne sur mer, NW France. Picture: Jean-Michel Sauvage.
adult LBBG France: graellsii
.
 Lesser Black-backed Gull graellsii 001N 5CY, 6CY, 8CY, 2009-2012, Calais, NW France. Picture: Jean-Michel Sauvage.
 Lesser Black-backed Gull graellsii 028A 5CY, August 04 2013, Calais, NW France. Picture: Walther Leers.
 Lesser Black-backed Gull graellsii 161N 5CY, August 01 2009, Calais, NW France. Picture: Jean-Michel Sauvage.
 Lesser Black-backed Gull graellsii 167N 6CY, August 12 2010, Boulogne sur mer, NW France. Picture: Jean-Michel Sauvage.
 Lesser Black-backed Gull graellsii FRP EA639851 / 192N 8CY, August 2009, April & July 2012, Calais, NW France. Picture: Jean-Michel Sauvage.
 Lesser Black-backed Gull graellsii 472N 6CY, August 19 2012, Boulogne sur mer, NW France. Picture: Jean-Michel Sauvage.
 Lesser Black-backed Gull graellsii R:C7A adult, August 07 2015, Leixões Harbour, Matosinhos, Portugal. Picture: José Marques.
 Lesser Black-backed Gull graellsii R:J4E adult, August 31 2017, Matosinhos beach, Matosinhos, Portugal. Picture: José Marques.
 Lesser Black-backed Gull graellsii R:U3S adult, August 31 2017, Matosinhos beach, Matosinhos, Portugal. Picture: José Marques.
adult LBBG Belgium: graellsii "Dutch intergrade"
.
 Lesser Black-backed Gull graellsii AFAF 6CY, August 15 2003, Westkapelle, the Netherlands.
  Lesser Black-backed Gull graellsii BDAA 11CY, August 12 2009, Calais, NW France. Picture: Jean-Michel Sauvage.
 Lesser Black-backed Gull graellsii BNAH 7CY, August 01 2003, Zeebrugge, Belgium.
 Lesser Black-backed Gull graellsii BUAM 7+CY, August 01 2003, Zeebrugge, Belgium.
 Lesser Black-backed Gull graellsii GRAR adult, August 20-27 2012, Katwijk, the Netherlands.
 Lesser Black-backed Gull graellsii x Yellow-legged Gull michahellis MLAT 9CY, August 29 2010, Boulogne sur mer, NW France. Picture: Jean-Michel Sauvage.
 Lesser Black-backed Gull graellsii BLB L-901906 11CY, August 27 2014, Boulogne sur mer, NW France. Picture: Jean-Michel Sauvage.
 Lesser Black-backed Gull graellsii BLB L-904718 13CY, August 09 2017, Boulogne sur mer, NW France. Picture: Jean-Michel Sauvage.
 Lesser Black-backed Gull graellsii BLB L-911577 adult, August 01 2010, Neeltje Jans, the Netherlands.
 Lesser Black-backed Gull graellsii BLB L-916545 adult, August 29 2014, Boulogne sur mer, NW France. Picture: Jean-Michel Sauvage.
adult LBBG the Netherlands:
graellsii "Dutch intergrade"
.
 Lesser Black-backed Gull graellsii 5.D adult, August 31 2017, Matosinhos beach, Matosinhos, Portugal. Picture: José Marques.
 Lesser Black-backed Gull graellsii 8.A adult, August 31 2017, Matosinhos beach, Matosinhos, Portugal. Picture: José Marques.
 Lesser Black-backed Gull graellsii H.F adult, August 01 2008, Boulogne-sur-mer, NW France. Picture: Jean-Michel Sauvage.
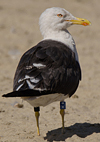 Lesser Black-backed Gull graellsii H.= adult, July 2015 & August 2017, the Netherlands & Portugal. Picture: Merijn Loeve & José Marques.
 Lesser Black-backed Gull graellsii D.7 adult, August - September 2010, Boulogne sur mer, NW France. Picture: Jean-Michel Sauvage.
 Lesser Black-backed Gull graellsii Z.5 adult, August 30 2016, IJmuiden, the Netherlands.
 Lesser Black-backed Gull graellsii 8.5 adult, August 29 2014, Boulogne sur mer, NW France. Picture: Jean-Michel Sauvage.
 Lesser Black-backed Gull graellsii N.E adult, August 16 2014, Boulogne sur mer, NW France. Picture: Jean-Michel Sauvage.
 Lesser Black-backed Gull graellsii U3 adult, August 17 2014, Rotterdam, the Netherlands. Picture: Merijn Loeve.
 Lesser Black-backed Gull graellsii H.N adult, August 28 2014, Boulogne sur mer, NW France. Picture: Jean-Michel Sauvage.
 Lesser Black-backed Gull graellsii SF adult, May 01 & August 10 2014, Maasvlakte, the Netherlands. Picture: Merijn Loeve.
 Lesser Black-backed Gull graellsii H5 adult, May 2006, October 2011 & August 2016, the Netherlands. Picture: Theo Muusse, Maarten van Kleinwee & Henri Zomer.
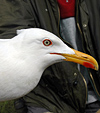 Lesser Black-backed Gull graellsii 79 adult, 2005, 2013 & 2014, Dordrecht & Moerdijk, the Netherlands. Picture: Merijn Loeve & Muusse brothers.
 Lesser Black-backed Gull graellsii YABW adult, August 16 2013, Boulogne-sur-Mer, NW France. Picture: Jean-Michel Sauvage.
 Lesser Black-backed Gull graellsii Y.ACP adult, August 30 2016, IJmuiden, the Netherlands.
 Lesser Black-backed Gull graellsii Y.ASR adult, August 30 2016, IJmuiden, the Netherlands.
 Lesser Black-backed Gull graellsii Y.AST adult, August 2014 & July 2016, Boulogne sur mer, NW France & IJmuiden, the Netherlands. Picture: Jean-Michel Sauvage & Mars Muusse.
 Lesser Black-backed Gull graellsii Y.BBU adult, August 22 2015, IJmuiden, the Netherlands.
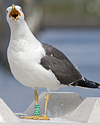 Lesser Black-backed Gull graellsii Y.BCF adult, August 20 2016, IJmuiden, the Netherlands.
 Lesser Black-backed Gull graellsii Y.BVL adult, August 30 2016, IJmuiden, the Netherlands.
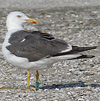 Lesser Black-backed Gull graellsii Y.BVP adult, August 30 2016, IJmuiden, the Netherlands.
 Lesser Black-backed Gull graellsii M.AAA August 22 2010, Madrid, Spain. Photo by Delfín González. Also seen in Dec.
 Lesser Black-backed Gull graellsii E019 / E 13CY, August 31 2017, Matosinhos beach, Matosinhos, Portugal. Picture: José Marques.
 Lesser Black-backed Gull graellsii E019 6CY & 11CY, May 2004 & Augsut 2009, Maasvlakte & Westkapelle, the Netherlands.
 Lesser Black-backed Gull graellsii E E580 14CY, August 08 2014, Delft, the Netherlands. Picture: Merijn Loeve.
 Lesser Black-backed Gull graellsii E699 11CY-12CY, September 09 2011 & August 20 2012, Katwijk, the Netherlands.
 Lesser Black-backed Gull graellsii RU5 12CY, August 08 2009, Calais, NW France. Picture: Jean-Michel Sauvage.
 Lesser Black-backed Gull graellsii E246 9CY, August 24 2003, Texel, the Netherlands. P1 missing.
 Lesser Black-backed Gull graellsii E914 7CY, August 18 2001, Missouriweg Maasvlakte, the Netherlands. P6 shed, P7-P10 are still old.
  Lesser Black-backed Gull graellsii EJ83 15CY, August-September 2010, Boulogne sur mer, NW France. Picture: Jean-Michel Sauvage.
 Lesser Black-backed Gull graellsii EM21 9CY, August 15 2004, Missouriweg Maasvlakte, the Netherlands. Ringed as pullus on July 10 1996.
 Lesser Black-backed Gull graellsii ER29 21CY, August 21 2016, Boulogne-sur-Mer, France (50.44 N - 01.35 E). Picture Jean-Michel Sauvage.
 Lesser Black-backed Gull graellsii ES43 15CY, August 12 2010, Boulogne sur mer, NW France. Picture: Jean-Michel Sauvage.
 Lesser Black-backed Gull graellsii CV8 18CY, August 29 2010, Boulogne sur mer, NW France. Picture: Jean-Michel Sauvage.
 Lesser Black-backed Gull graellsii KR7 11CY, August 12 2004, Westkapelle, the Netherlands. Dark individual. Ringed July 07 1993.
 Lesser Black-backed Gull graellsii EV24 9CY, August 12 2004, Westkapelle, the Netherlands. dark individual. Ringed July 12 1996.
 Lesser Black-backed Gull graellsii ME9 11CY, August 12 2004, Westkapelle, the Netherlands. dark individual. Ringed July 01 1993.
 Lesser Black-backed Gull graellsii N527 adult, August 04 2010, Heemskerk, the Netherlands. Ringed in Spain in winter.
 Lesser Black-backed Gull graellsii hybrid =3 August 22 2003, IJmuiden, the Netherlands. Ringed in the Netherlands in 1999.
 Lesser Black-backed Gull graellsii NLA 5.330.562 19CY, August 18 2015, IJmuiden, the Netherlands.
 Lesser Black-backed Gull graellsii 14-15cy NLA 5.330.969 September 2010 & August 2011, Boulogne sur mer, NW France. Picture: Jean-Michel Sauvage.
 Lesser Black-backed Gull graellsii adult NLA 5.333.53x August 28 2003, IJmuiden, the Netherlands. Ringed in the Netherlands. P8-P10 are still old, P5 slightly shorter than P4.
 Lesser Black-backed Gull graellsii adult NLA 5.461.302 2010 & 2012, Boulogne sur mer, NW France. Picture: Jean-Michel Sauvage.
adult LBBG Denmark: intermedius
.
 Lesser Black-backed Gull intermedius V3SJ 6CY, July 2010, August 2014 & October 2014, Utrecht, the Netherlands. Also as 2CY.
 Lesser Black-backed Gull intermedius DKC 4139177 9CY, August 28 2014, Boulogne sur mer, NW France. Picture: Jean-Michel Sauvage.
 Lesser Black-backed Gull intermedius DKC 4271507 7CY, August 12 2004, Westkapelle, the Netherlands. Ringed in Denmark.
adult LBBG Norway: intermedius
.
 Lesser Black-backed Gull intermedius J0K1 11CY, August 31 2017, Matosinhos beach, Matosinhos, Portugal. Picture: José Marques.
 Lesser Black-backed Gull intermedius JC4T adult female, August 04 2015, Boulogne-sur-Mer, France. Picture: Jean-Michel Sauvage.
 Lesser Black-backed Gull intermedius JK1E 6CY, August 02 2017, Tangen Avfallsplass, Askim, Østfold, Norway. Picture: Carl Baggott.
 Lesser Black-backed Gull intermedius JK7K adult, August 02 2017, Tangen Avfallsplass, Askim, Østfold, Norway. Picture: Carl Baggott.
 Lesser Black-backed Gull intermedius JU8A adult, August 02 2017, Tangen Avfallsplass, Askim, Østfold, Norway. Picture: Carl Baggott.
 Lesser Black-backed Gull intermedius J452N adult, August 02 2017, Tangen Avfallsplass, Askim, Østfold, Norway. Picture: Carl Baggott.
 Lesser Black-backed Gull intermedius J4687 adult, August 02 2017, Tangen Avfallsplass, Askim, Østfold, Norway. Picture: Carl Baggott.
 Lesser Black-backed Gull intermedius J556N adult, August 02 2017, Tangen Avfallsplass, Askim, Østfold, Norway. Picture: Carl Baggott.
 Lesser Black-backed Gull intermedius J587N adult, August 02 2017, Tangen Avfallsplass, Askim, Østfold, Norway. Picture: Carl Baggott.
 Lesser Black-backed Gull intermedius J712A adult, August 02 2017, Tangen Avfallsplass, Askim, Østfold, Norway. Picture: Carl Baggott.
 Lesser Black-backed Gull intermedius J5JS 12CY, August 21 2017, Boulogne sur mer, NW France. Picture: Jean-Michel Sauvage.
 Lesser Black-backed Gull (intermedius) JS47 adult, January 25 2008, Westkapelle & August 23-24 2008, IJmuiden, the Netherlands.
 Lesser Black-backed Gull intermedius NOS 4111326 12CY, August 29 2003, IJmuiden, the Netherlands. Ringed in Norway. P5-P10 are still old, P3 fully grown.
 Lesser Black-backed Gull intermedius NOS 4163669 13CY, August 29 2003, IJmuiden, the Netherlands. P7-P10 are still old, P3 fully grown.
 Lesser Black-backed Gull intermedius NOS 4191125 5CY, August 28 2003, IJmuiden, the Netherlands. P6-P10 are still old, P3 fully grown.
 Lesser Black-backed Gull intermedius NOS 4196745 19CY, August 25 2012, Boulogne-sur-Mer, NW France. Picture: Jean-Michel Sauvage.
 Lesser Black-backed Gull intermedius NOS 4209478 9CY, August 12 2004, Westkapelle, the Netherlands (51.33N-03.25E).
 Lesser Black-backed Gull intermedius NOS 492081 19CY, August 11 2003, Boulogne/Mer, France. P5-P10 are still old. All rectrices old.
adult LBBG Sweden: intermedius
.
 Lesser Black-backed Gull intermedius SVS 8081001 9CY, August 28 2003, IJmuiden, the Netherlands. Ringed in Sweden. P5-P10 are still old, P2 is fully grown.
adult LBBG Portugal: trapped in winter
.
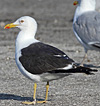 Lesser Black-backed Gull POL MN02178 adult, August 21 2014, Boulogne sur mer, NW France. Picture: Jean-Michel Sauvage.
adult LBBG unringed
.
 Lesser Black-backed Gull adult, August 21 2017, Katwijk, the Netherlands.
 Lesser Black-backed Gull adult, August 20 2012, Katwijk, the Netherlands. P1 still old.
 Lesser Black-backed Gull adult, August 22 2012, Katwijk, the Netherlands. P1 still old.
 Lesser Black-backed Gull adult, August 22 2012, Katwijk, the Netherlands. P1 still old.
 Lesser Black-backed Gull adult, August 24 2003, Texel, the Netherlands. P1-10 old.
 Lesser Black-backed Gull adult, August 24 2003, Texel, the Netherlands. P1-10 old.
 Lesser Black-backed Gull adult, August 22 2012, Katwijk, the Netherlands. P1/P3.
 Lesser Black-backed Gull adult, August 22 2012, Katwijk, the Netherlands. P1/P4.
 Lesser Black-backed Gull adult, August 20 2012, Katwijk, the Netherlands. P1/P4.
 Lesser Black-backed Gull adult, August 22 2012, Katwijk, the Netherlands. P1/P5.
 Lesser Black-backed Gull adult, August 20 2012, Katwijk, the Netherlands. P2/P4.
 Lesser Black-backed Gull adult, August 20 2012, Katwijk, the Netherlands. P2/P4, P6 much older.
 Lesser Black-backed Gull adult, August 22 2012, Katwijk, the Netherlands. P2/P5.
 Lesser Black-backed Gull adult, August 20 2012, Katwijk, the Netherlands. P2/P5.
 Lesser Black-backed Gull adult, August 20 2012, Katwijk, the Netherlands. P2/P5.
 Lesser Black-backed Gull adult, August 20 2012, Katwijk, the Netherlands. P2/P5.
 Lesser Black-backed Gull adult, August 20 2012, Katwijk, the Netherlands. P2/P5.
 Lesser Black-backed Gull adult, August 22 2012, Katwijk, the Netherlands. P2/P6.
 Lesser Black-backed Gull adult, August 22 2012, Katwijk, the Netherlands. P2/P6.
 Lesser Black-backed Gull adult, August 20 2012, Katwijk, the Netherlands. P3/P7.
 Lesser Black-backed Gull adult, August 20 2012, Katwijk, the Netherlands. P3/P7.
 Lesser Black-backed Gull adult, August 20 2012, Katwijk, the Netherlands. P4/P6.
 Lesser Black-backed Gull adult, August 20 2012, Katwijk, the Netherlands. P4/P7.
 Lesser Black-backed Gull adult, August 20 2012, Katwijk, the Netherlands. P4/P8.
 Lesser Black-backed Gull adult, August 20 2012, Katwijk, the Netherlands. P4/P8.
 Lesser Black-backed Gull adult, August 22 2012, Katwijk, the Netherlands. P5/P8.
 Lesser Black-backed Gull adult, August 20 2012, Katwijk, the Netherlands. Together with argenteus and michahellis.
 Lesser Black-backed Gull adult, August 20 2012, Katwijk, the Netherlands.
 Lesser Black-backed Gull adult, August 22 2012, Katwijk, the Netherlands.
 Lesser Black-backed Gull adult, August 22 2012, Katwijk, the Netherlands.